
Haryana Board Solutions For Class 7 Maths Chapter 3 Data Handling
Key Concepts
- Data:
A data is a collection of numbers gathered to give some information. - We collect data by several ways. They are through newspapers, magazines, television and through various sources. All the data collected give us some sort ofinformation.
- Collection of Data:
Any set of data can give us some inferences butifwe want tofind a specific information,we need to collect data which can tell us about that. Some of these data are easy to collect and some are difficult.
Below are given a few situations:
Performance of your class in Mathematics.
Performance of India in football or in cricket.
Female literacy rate in a given area.
Number of children below the age of 5 years in the families around the area. - Organization of Data:
After collecting the data we have to record and organize it.
Different kinds of data we come across in our daily life are put in a tabular form. Our school rolls, progress report, indexin the text books, temperature record and many other are recorded in a tabular form.
If we record them in a proper table it becomes easy to understand and interpret. - The information eitherin theform ofpictures,numbers or words is called ‘Data’.
- Based on method of collecting information the data is divided into two different types namely, ‘Primary data’ and ‘Secondary data’.
- Primary Data: The data collected directly through personal experiences, interviews, direct observations etc., is called ‘Primary data’.It is also called ‘raw data’ or firsthand’ information.
- Secondary Data: The information which has been collected in the past by someone else but used by the investigator is called ‘Secondary Data’.
- Range of the data: The difference between maximum and minimum values of data is called ‘Range’ of the data.
- Measures of Central Tendency: Arithmetic mean, mode, and median.
- Arithmetic mean (or) Average: The sum of observations ofdata is divided by number of observations of a data is called Arithmetic mean (or) Average (or) Mean.
\( \text { Arithmetic mean }=\frac{\text { Sum of observations }}{\text { Number of observations }} \) - ‘Arithmetic Mean’ is a number or value that represents or shows the central tendency of a group of observations of data.
- ‘Arithmetic Mean’ of given data always lies between the highest and lowest observations of the data.
- The most common representative (or) central tendency value of a grouped data is average or Arithmetic mean.
- Mode: The observation which occurs most frequently in the given data is called ‘Mode’ of the data.
- Data having only one mode, is known as ‘Unimodal data’.
- Data having two modes is known as ‘Bimodal data’.
- Median: The middle most value of the data, when the observations are arranged in either ascending or descending order is called ‘median’.
- If the number of observations is odd then median is \( \left(\frac{(n+1)}{2}\right)^{\text {th }} observation. \)
- If the number of observations is even then the median is average of \( \left(\frac{\mathrm{n}}{2}\right)^{\mathrm{th}} \) and \( \left(\frac{n}{2}+1\right)^{t h} \) observation.
- Bargraph: Representation o fnumerical data by using bars of uniform width is called ‘Bar graph’.
- In bar graphs the width of all rectangles (bars) is equal and height (lengths) of each bar is proportional to the data that it represents.
- Double bar graph: Representation of two sets ofnumerical data on the same graph by using bits of uniform width is called double
bar graph. - Pie charts: A pie chart is the representation ofthe numerical data by sectors ofthe circle such that angle ofeach sector(area ofsector) is proportional to value of the given data.
- The parts ofcircles are called ‘sectors’
- Angle of sector
\( =\frac{\text { Value of the item }}{\text { Sum of the values of all items }} \times 360^{\circ} \) - It You will find that when all the values of data set are increased or decreased by a certain number, the mean also increases or decreases by the same number.
- Note: If each observation in a data set is repeated an equal number of times or if no score is repeated then the data set has no mode.
1. How would you find the average of your study hours for the whole week?
Solution: First,I will find the study hours of all the 7 days of the week separately.
Then find the sum of all these study hours and divide by 7.
1. Find the mean of your sleeping hours during one week.
Solution: Students can arrange the data with the help of their parents and then solve with the help of teacher.
2. Find at least 5 numbers between \( \frac{1}{2} \) and \( \frac{1}{3} \)
Solution: 1st number
\( =\frac{\frac{1}{2}+\frac{1}{3}}{2}=\frac{\frac{3+2}{6}}{2}=\frac{5}{6 \times 2}=\frac{5}{12} \)2nd number
\( =\frac{\frac{1}{2}+\frac{5}{12}}{2}=\frac{\frac{6+5}{12}}{2}=\frac{11}{12 \times 2}=\frac{11}{24} \)3rd number
\( =\frac{\frac{5}{12}+\frac{1}{3}}{2}=\frac{\frac{5+4}{12}}{2}=\frac{9}{12 \times 2}=\frac{9}{24} \)4th number
\(=\frac{\frac{5}{12}+\frac{11}{24}}{2}=\frac{\frac{10+11}{24}}{2}=\frac{21}{24 \times 2}=\frac{21}{48} \)
5th number
\( =\frac{\frac{11}{24}+\frac{9}{24}}{2}=\frac{\frac{11+9}{24}}{2}=\frac{20}{24 \times 2}=\frac{20}{48} \)The required five numbers are:
\( \frac{5}{12}, \frac{11}{24}, \frac{9}{24}, \frac{21}{48}, \frac{20}{48} \)Haryana Board Solutions For Class 7 Maths Chapter 3 Data Handling Exercise-3.1
1. Find the range of heights of any ten students of your class.
Solution:
Let’s assume we have the following heights (in cm) for ten students
145, 150, 142, 155, 148, 160,135, 155, 140,165
Range = 165 cm- 135 cm
= 30 cm
HBSE Class 7 Data Handling Solutions
2. Organise the following marks in a class assessment, in a tabular form.
4, 6, 7, 5, 3, 5, 4, 5, 2, 6, 2, 5,1, 9, 6, 5, 8, 4, 6, 7
The frequency table:
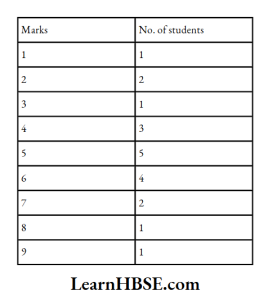
1) Which number is the highest?
Solution: 9
2) Which number is the lowest?
Solution: 1
3) What is the range of the data?
Solution: Range = Highest observation.
Lowest observation = 9-1=8
Haryana Board Class 7 Maths Data Handling Solutions
4) Find the arithmetic mean.
Solution: Arithmetic mean
\( =\frac{\text { Sum of all observations }}{\text { Number of observations }} \) \( \begin{gathered}=\frac{4+6+7+5+3+5+4+5+2+6+2+5+1+9+6+5+8+4+6+7}{20} \\
=\frac{100}{20}=5
\end{gathered} \)
3. Find the mean of the first five whole numbers.
Solution: First five whole numbers are 0, 1, 2, 3, 4
\text { Mean }= & \frac{\text { Sum of all observations }}{\text { Number of observations }} \\
& =\frac{0+1+2+3+4}{5}=\frac{10}{5}=2
\end{aligned} \)
4. A cricketer scores the following runs in eight innings: 58,76,40,35, 46,45,0,100. Find the mean score.
Solution: Given observations: 58, 76, 40, 35, 46, 45, 0, 100
\( \begin{aligned}& \text { Mean }=\frac{\text { Sum of all observations }}{\text { Number of observations }} \\
& =\frac{58+76+40+35+46+45+0+100}{8} \\
& =\frac{400}{8}=50
\end{aligned} \)
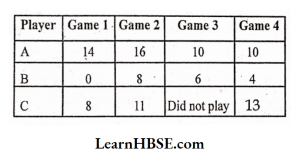
5. Following table shows the points of each player scoredin four games.
Solution:
Now answer the following questions:
1) Find the mean to determine A’s average number of points scored per game.
Solution: Points of A in all the four games’are 14, 16, 10, 10
\( \begin{aligned}\text { Mean } & =\frac{\text { Sum of all the observations }}{\text { Number of observations }} \\
& =\frac{14+16+10+10}{4}=\frac{50}{4}=12.5
\end{aligned} \)
2) To find the mean number of points per game for C, would you divide the total points by 3 or by 4 ? Why ?
Solution: To find the mean number of points per game for C we divide the total points by 3 because the number of games under consideration is 4 but ‘C’ did not play the 3rd game.
Key Questions in Data Handling for Class 7 HBSE
3) B played in all the four games. How would you find the mean ?
Solution: Points of B in all the four games are 0, 8, 6, 4
\( \begin{aligned}\text { Mean } & =\frac{\text { Sum of all the observations }}{\text { Number of observations }} \\
& =\frac{0+8+6+4}{4}=\frac{18}{4}=4.5
\end{aligned} \)
4) Who is the best performer?
Solution:
A’s average =12.5
B’s average =4.5
C’s average = \( \frac{8+11+13}{3}=\frac{32}{3}=10.67 \)
A is the best performer.
Class 7 Maths Chapter 3 Data Handling Haryana Board
6. The marks (out of 100) obtained by a group of students in a science test are 85, 76, 90, 85, 39, 48, 56, 95, 81 and 75.
Find the:
1) Highest and the lowest marks obtained by the students.
Solution:
Highest marks obtained by the students = 95
Lowest marks obtained by the students = 39
2) Range of the marks obtained.
Solution:
Range = Highest marks- Lowest marks = 95 – 39 = 56
3) Mean marks obtained by the group
Solution:
\( \begin{aligned}& \text { Mean }=\frac{\text { Sum of all observations }}{\text { Number of observations }} \\
& =\frac{85+76+90+85+39+48+56+95+81+75}{10} \\
& =\frac{730}{10}=73
\end{aligned} \)
7. The enrolment in a school during six consecutive years was as follows: 1555, 1670, 1750, 2013, 2540, 2820. Find the mean enrollment of the school for this period.
Solution:
\( \begin{aligned}& \text { Mean }=\frac{\text { Sum of all observations }}{\text { Number of observations }} \\
& =\frac{1555+1670+1750+2013+2540+2820}{6} \\
& =\frac{12348}{6}=2058
\end{aligned} \)
8. The rainfall (in mm) in a city on 7 days of a certain week was recorded as follows:
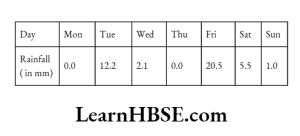
1) Find the range of the rainfall in the above data.
Solution:
Range of the rainfall
Highest rainfall – Lowest rainfall
= 20.5 – 0.0- 20.5 mm
2) Find the mean rainfall for the week.
Solution: Mean rainfall for the week
\( \begin{aligned}& =\frac{\text { Sum of all observations }}{\text { Number of observations }} \\
& =\frac{0.0+12.2+2.1+0.0+20.5+5.5+1.0}{7} \\
& =\frac{41.3}{7}=5.9
\end{aligned} \)
Sample Problems Data Handling Haryana Board Class 7
3) On how many days was the rainfall less than the mean rainfall?
Solution:
On 5 days the rainfall is less than the mean rainfall.
The heights of 10 girls were measured in cm and the results are as follows: 135, 150, 139’ 128, 151, 132, 146, 149, 143,141.
1) What is the height of the tallest girl?
Solution: Height of the tallest girl – 151 cm
2) What is the height of the shortest girl?
Solution. Height of the shortest girl = 128
3) What is the range of the data?
Solution: Range of the data = Highest observation – Lowest observation=151-128 = 23 cm
Haryana Board 7th Class Maths Data Handling Questions and Answers
4) What is the mean height of the girls?
Solution: Mean height of the girls
\( \begin{aligned}& =\frac{\text { Sum of all observations }}{\text { Number of observations }} \\
& =\frac{135+150+139+128+151+132+146+149+143+141}{10} \\
& =\frac{1414}{10}=141.4 \mathrm{~cm}
\end{aligned} \)
5. How many girls have height more than the mean height ?
Solution: 5 girls have heights more than the mean height
Solutions To Try These
Find the mode of
1) 2, 6, 5, 3, 0,3, 4, 3, 2, 4, 5, 2, 4.
Solution: Arranging the numbers with same values together, we get 0,2, 2, 2, 3, 3, 3, 4, 4, 4, 5, 5, 6.
Mode of this data are 2, 3, 4 because they occur most often.
2) 2, 14, 16, 12, 14, 14, 16, 14, 10, 14, 18, 14.
Solution: Arranging the numbers with same values together we get 2, 10, 12, 14, 14, 14, 14, 14, 14, 16, 16, 18
Mode of this data is 14
Solutions To Try These
1. Find the mode of the following data: 12, 14, 12,16, 15, 13,14, 18, 19, 12, 14, 15, 16, 15, 16,16, 15,17, 13, 16, 16, 15, 15, 13, 15,17,15, 14, 15,13, 15, 14.
Solution: Let us put the data in a tabular form:
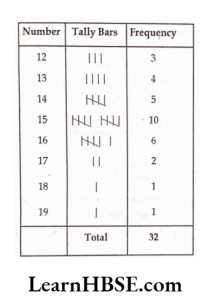
Mode of this data is 15.
2. Heights (in cm) of 25 children are given below: 168, 165, 163, 160, 163, 161, 162, 164, 163, 162, 164, 163, 160, 163, 160, 165, 163, 162, 163, 164, 163, 160, 165, 163, 162. What is the mode of their heights? What do we understand by mode here?
Solution: Arranging the data in ascending order :
160, 160, 160, 160, 161, 162, 162, 162, 162, 163, 163, 163, 163,163, 163, 163, 163, 163, 164, 164, 164, 165, 165, 165, 168.
Here 163 cm occurred the highest number of times.
Mode = 163
We understand that most of the students have height of 163 cm.
Solutions To Try These
Discuss with your friends and give
1) Two situations where mean would be an appropriate representative value to use, and
2) Two situations where mode would be an appropriate representative value to use.
Solution:
1) Two situations where mean would be appropriate:
1. Average grades
2. Age distribution
2) Two situations where mode would be appropriate:
1. Preferred mode of transportation
2. Clothing sizes
In these situations, the mean is suitable for calculating the average or overall value, while the m useful for identifying tire most frequently occurring value in the dataset.
Solutions To Try These
Your friend found the median and the mode of a given data. Describe and correct your friends error if any : 35, 32, 35, 42, 38, 32, 34 Median 42, Mode 32
Solution: Arranging the data in ascending order :
32, 32, 34, 35, 35, 38, 42
Median is the middle observation
Median =35
Here 32, 35 occurred two times
Mode – 32, 35
Haryana Board Class 7 Data Collection and Organization
Haryana Board Solutions For Class 7 Maths Chapter 3 Data Handling Exercise-3.2
1, The scores in Mathematics test (out of 25) of 15 students is as follows: 19, 25, 23, 20, 9, 20, 15, 10, 5, 16, 25, 20, 24, 12, 20. Find the mode and median of this data Are they same?
Solution: Given scores: 19, 25, 23, 20, 9, 20,15, 10, 5, 16, 25, 20, 24, 12, 20
Median: Arranging the data in ascending order: 5, 9, 10, 12, 15, 16,19, 20, 20, 20, 20, 23, 24, 25, 25
Median is the middle observation.
Median = 20
Mode: 20 occurred more frequently
A Mode =20
Yes, median and mode of the given scores are same.
2. The rims scored in a cricket match by 11 players is as follows: 6, 15, 120, 50, 100, 80, 10, 15, 8, 10, 15 Find the mean, mode and median of this data. Are the three same ?
Solution:
Given: Runs scored in a cricket match by 11 players 6, 15, 120, 50, 100, 80, 10, 15,8,10,15.
1) Mean:
\( \begin{aligned}& \quad \text { Mean }=\frac{\text { Sum of all observations }}{\text { Number of observations }} \\
& =\frac{6+15+120+50+100+80+10+15+8+10+15}{11} \\
& =\frac{429}{11}=39
\end{aligned} \)
∴ Mean = 39
2) Median:
Arranging the datain ascending order : 6, 8, 10, 10, 15, 15, 15, 50, 80, 100, 120
Median is the middle observation.
Median = 15
3) Mode:
Mode is the observation with highest frequency.
Mode = 15
Here mean, mode and median are not same
Chapter 3 Data Handling Class 7 Solutions in Hindi Haryana Board
3. The weights (in kg.) of15 students of a class are: 38, 42/ 35, 37, 45, 50, 32, 43, 43, 40, 36, 38, 43, 38, 47
1) Find the mode and median of this data.
2) Is there more than one mode?
Solution:
1) The weights (in kg.) of 15 students of a class. 38, 42, 35, 37, 45, 50, 32, 43, 43, 40, 36, 38, 43, 38, 47
Median:
Arranging the grades in ascending order: 32, 35, 36, 37, 38, 38, 38, 40, 42, 43, 43, 43, 45, 47, 50
∴ Median = 40
Mode: It is the observation with highest frequency
Mode = 38 ;43
2) Yes there are two modes. i.e. 38 and 43.
4. Find the mode andmedian of the data: 13, 16,12,14, 19, 12, 14, 13, 14
Solution:
Given data:13,16,12,14,19,12,14,13,14 Median:
Arranging the data in ascending order: 12,12,13,13,14,14,14,16,19
Median = 14
Mode: It is the observation with highest frequency.
Mode = 14
5. Tell whether the statement is true or false:
1) The mode is always one of the – True
2) The mean is one of the numbers in a data. – False
3) The median is always one of the numbers in a data. -True
4) The data 6, 4, 3, 8, 9, 12, 13, 9 has mean 9. – False
Solutions To Try These
1. The bar graph shows the result of a survey to test water-resistant watches made by different companies. Each of these companies claimed that their watches were water-resistant. After a test the above results were revealed.
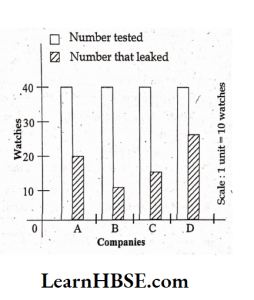
1) Can you work out a fraction of the number of watches that leaked to the number tested for each company?
Solution: In scale:1 unit = 10 watches
For company A: Required ratio
\( =\frac{200}{400}=\frac{1}{2} \)For company B: Required ratio
\( =\frac{100}{400}=\frac{1}{4} \)For company C: Required ratio
\( =\frac{150}{400}=\frac{15}{40}=\frac{15 \div 5}{40 \div 5}=\frac{3}{8} \)For company D: Required ratio
\( =\frac{250}{400}=\frac{25}{40}=\frac{25 \div 5}{40 \div 5}=\frac{5}{8} \)2) Could you tell on this basis which company has better watches?
Solution: Company B has better watches.
2. Sale of English and Hindi books in the years 1995,1996,1997 and 1998 are given below:
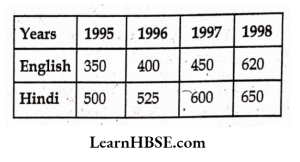
Draw a double bar graph and answer the following questions
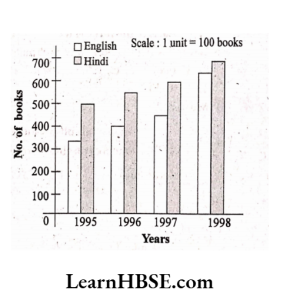
1) In which year was the difference in the sale of the two language books least?
Solution:
Difference
In 1995 —> 500-350 = 150
In1996 —> 525 – 400 = 125
In 1997 —> 600- 450 = 150
In 1998 —> 650-620 = 30
In the year 1998 the difference in the sale of two language books is least
2) Can you say that the demand for the English books rose faster? Justify.
Solution: Yes, we can say that the demand for English books rose faster.
Haryana Board Solutions For Class 7 Maths Chapter 3 Data Handling Exercise-3.3:
1. Use the bar graph to answer the following questions.
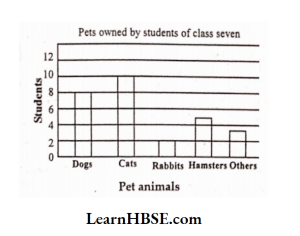
1) Which is the most popular pet?
Solution: ‘Cat’ is the most popular pet.
2) How many students have dog as a pet?
Solution: 8 students have a dog as a pet.
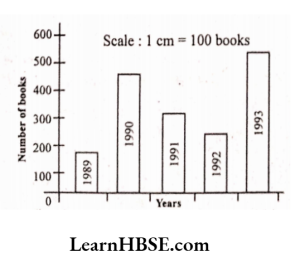
2. Read the bar graph which shows the number of books sold by a bookstore during five consecutive years and answer the following questions:
Haryana Board Class 7 Maths Exercise 3.1 Solutions
1) About how many books were sold in 1989? 1990? 1992?
Solution: Number of books sold in 1989 = 175 (approx)
Number of books sold in 1990 = 475 (approx)
Number of books sold in 1992 = 225 (approx)
2) In which year were about 475 books sold? About 225 books sold?
Solution:
About 475 books were sold in 1990.
About 225 books were sold in 1992.
3) In which years were fewer than 250 books sold ?
Solution: In the years 1989 and 1992 fewer than 250 books were sold.
4) Can you explain how you would estimate the number of books sold in 1989?
Solution: From the bar graph reading it is clear that the number of books in 1989 is 175.
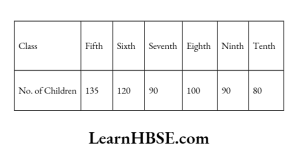
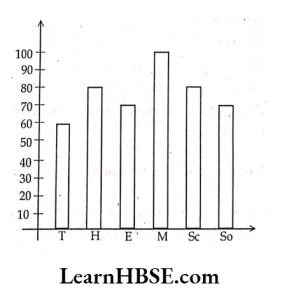
3. Number of children in six different classes are given below. Represent the data on a bar graph.
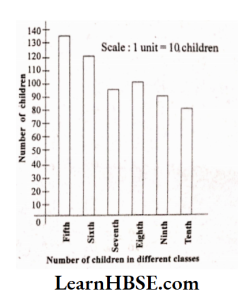
1) How would you choose a scale?
Solution: Start the scale at ‘O’.
The greatest value in the given data is 135. So mark the scale at the value greater than 135 such as 140. Use equal division along axes such as an increment of 10. Take 1 unit for 10 children.
2) Answer the following questions:
1) Which class has the maximum number of children ? And the minimum ?
Solution:
Fifth class has the maximum number of children.
Tenth class has the minimum number of children.
2) Find the ratio of students of class sixth to the students of class eight.
Solution: Ratio of students of class sixth to eighth = 120 : 100
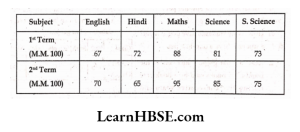
\( =\frac{120}{100}=\frac{6}{5}=6: 5 \)4. The performance of a studentin l9t term and 2nd term is given. Draw a double bar graph choosing appropriate scale and answer the following:
Solution:
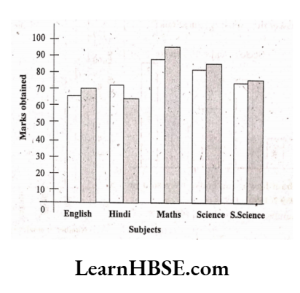
1) In which subject, has the child improved his performance the most ?
Solution: In Maths the child has improved his performance the most.
2) In which subject is the improvement the least ?
Solution: HisScience the child’s improvement is the least.
3) Has the performance gone downin any subject ?
Solution: Yes, his performance has gone downin Hindi.
5. Consider this data collected from a survey of a colony.
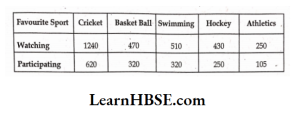
1) Draw a double bar graph choosing an appropriate scale. What do you infer from the bar graph?
Solution:
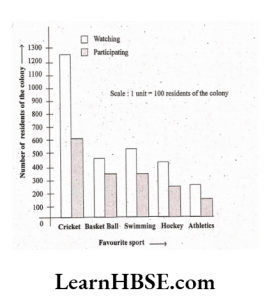
Inference: The residents of the colony like cricket the most and athletics tire least
2) Which sport is most popular?
Solution: Cricket is most popular watching as well as participating.
3) Which is more preferred, watching or participating in sports?
Solution: Watching sports is more preferred than participating in sports.
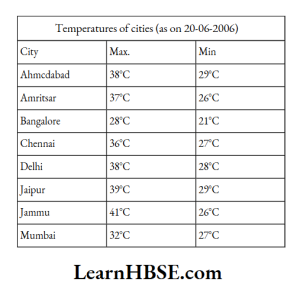
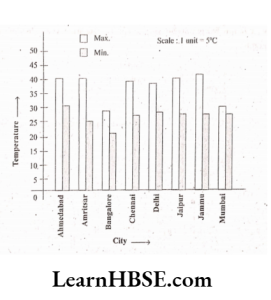
6. Take the data giving the minimum and the maximum temperature of various cities given in the beginning of this chapter. Plot a double bar graph using the data and answer the following:
HBSE Class 7 Maths Chapter 3 Guide
1) Which city has the largest difference in the minimum and maximum temperature on the given data?
Solution:
Ahmedabad → 38°- 29° = 9°C;
Bangalore → 28°- 21° = 7°C;
Delhi → 38°-28° =10°C ;
Jammu → 41°- 26° = 15°C;
Amritsar → 37°- 26°= 11°C
Chennai → 36°- 27° = 9°C
Jaipur → 39°- 29° = 10°C
Mumbai → 32°- 27° = 5°C
Jammu has the largest difference in the minimum and maximum temperatures on the given data.
2) Which is the hottest city and which is the coldest city?
Solution: Jammu is the hottest city and Bangalore is the coldest city.
3) Name two cities where maximum temperature of one was less than the minimum temperature of the other.
Solution: Bangalore and Ahmedabad orBangalore and Jaipur.
4) Name the city which has the least difference between its minimum and the maximum temperature.
Solution: Mumbai.
Additional Questions
Haryana Board Solutions For Class 7 Maths Chapter 3 Data Handling Very Short Answer Questions
1. What is meant by a data?
Solution:
A data is a collection of numbers gathered to give some information.
2. Define ‘Range’ of a data.
Solution:
The difference between the highest and the lowest observations of a data is called range
3. Find the arithmetic mean of 17, 31, 12,27,15,19,23
Solution:
\( \text { Mean }=\frac{\text { Sum of all observations }}{\text { Number of observations }} \) \( \begin{aligned}& =\frac{17+31+12+27+15+19+23}{7} \\
& =\frac{144}{7}=20.57
\end{aligned} \)
4. Find the range of the scores 18, 26, 23,16, 32, 18
Solution:
Range = Highest observation- Lowest observation
32-16 = 16.
Important Questions for Class 7 Maths Chapter 3 Haryana Board
5. Find the mode of the numbers 10, 8, 4,6, 10, 3, 10.
Solution:
Here 10 occurs 3 times
Mode = 10
6. Define ‘Median’.
Solution:
The data is arranged in the order of increasing or decreasing magnitude then the middle most value in this arrange ment is called median.
7. Find the median of 10, 20, 15, 29, 35,42, 14.
Solution: The values are arranged in increasing order 10,14,15, 20, 29,35, 42 Then the middle most value 20 is the median.
8. Find the arithmetic mean of first three multiples of 5.
Solution:
First three multiples of 5 are = 5, 10, 15
Arithmetic mean
\( =\frac{\text { Sum of observations }}{\text { Number of observations }} \) \( =\frac{5+10+15}{3}=\frac{30}{3}=10 . \)9. What is the range of first ten whole numbers ?
Solution: First ten whole numbers are 0,l, 2, 3, 4,5, 6, 7, 8 and 9
Range
= Maximum value – minimum value
=9-0=9
10. Find the mean of the first five prime numbers.
Solution:
The numbers are 2, 3, 5, 7, 11
Sum ofnumbers = 2 +.3 + 5 + 7+11 = 28
\( \text { Mean }=\frac{28}{5}=5.6 \)11. Amounts donated by eight students to ‘NIVAR’ cyclone effected people are 300, 450, 700, 650, 400, 900, 850. Find the Arithmetic Mean of amounts donated.
Solution: The amounts donatedby eight students are 300, 450,700, 650, 400, 750, 900,850.
Number of students = 8
Arithmetic mean of amounts donated
\( =\frac{\text { Sum of observations }}{\text { Number of observations }} \) \( =\frac{300+450+700+650+400+750+900+850}{8} \)\( =\frac{5000}{8} \) = 625.
12. 20 students were participated in “SWATCH BHARAT ABHIYAN” campaign. The number of days each student participated were 5,1, 2, 4,1, 2, 3, 2,1, 2, 3, 2, 5, 3, 4, 2,1, 3, 4 and 5. Find mode of the data.
Solution: The number of days each student participated were 5,1, 2, 4,1, 2, 3, 2,1, 2,3, 2, 5, 3, 4, 2, 1,3, 4 and 5.
By arranging the numbers of saipe values together.
1,1, 1,1, 2, 2, 2, 2, 2, 2, 3, 3, 3, 3, 4, 4; 4, 5,5,5.
‘2’ occcurs most frequentlyin the data.
Mode = 2.
13. The number of pages in textbooks of different subjects are 421,175, 128>117, 150, 145, 147 and 113 find median of given data.
Solution: The number of pages in textbooks of different subjects are 421, 175, 128, 117,150, 145, 147 and 113.
Arrange the observations in ascending order113,117,128,145,147,150,175, 421.
In ‘8’ observations the 4th and 5th observations are middle most values
\( \text { Median }=\frac{145+147}{2}=\frac{292}{2}=146 .\)14. In a set of four integers, the average of the two smallestintegers is 102, the average of the three smallest integers is 103, the average ofallfouris104. Which is the greatest of these integers ?
Solution:
Average of all four = 104
Total of four integers = 4 x 104 = 416
Total of three integers = 3 x 103 = 309
4th No = 416 -309 = 107
Total of two integers = 2 x 102 = 204
3rd No = 309- 204 = 105
Similarly 2nd is 103 & 1st is 101
The numbers are 101, 103, 105 & 107
Greatest = 107
15,. The monthly income (in rupees) of 7 households in a village are 1200, 1500, 1400,1000,1000,1600,10000. (1) Find the median income of the house holds, (2) If one more household with monthly income 1500is added, what will the median income be?
Solution: Monthly income (in rupees) are 1200, 1500, 1400, 1000, 1000, 1600, 10000
Rearrangingin ascending order, the income 1000, 1000, 1200, 1400, 1500, 1600 and 10,000
It can be seen 1400 is the median. By inclusion of one more item of 1500 and rearranging the incomes are 1000, 1000, 1200, 1400, 1500, 1500, 1600 & 10,000
From which we find both 1400 & 1500 are in the middle of the values.
The median, therefore is calculated by the average of the two middle values. i.e
\( =\frac{1400+1500}{2}=\frac{2900}{2}=1450\)The median income = 1450
16. How many distinct sets of three positive integers have a mean of 6, a median of 7, and no mode ?
Solution: Let the integers be x, y & z
such that mean, 6 = \( \frac{x+y+z}{3} \)
ie x + y + z = 18
given median = 7
x + z = 11
x & z may be
1, 10
2,9
3,8
4,7
&5,6
such that sets of three positive integers satisfying the data are
1, 7, 10 fulfilling the condition
2, 7, 9 of mean = 6
3, 7, 8 median = 7
Haryana Board Solutions For Class 7 Maths Chapter 3 Data Handling Long Answer Questions
17. Find arithmetic mean of
1) 4,5,11,8
2) 10, 15, 21, 12, 17
3) \( \frac{1}{4}, \frac{1}{2}, \frac{3}{4}, \frac{3}{2}, \frac{5}{4} \)
1) 4,5,11,8
Solution: Arithmetic mean
\( \begin{aligned}& =\frac{\text { Sum of observations }}{\text { Number of observations }} \\
& =\frac{4+5+11+8}{4}=\frac{28}{4}=7
\end{aligned} \)
2) 10, 15, 21, 12, 17
Solution: Arithmetic mean
\( \begin{aligned}& =\frac{\text { Sum of observations }}{\text { Number of observations }} \\
& =\frac{10+15+21+12+17}{5} \\
& =\frac{75}{5}=15
\end{aligned} \)
3.\( \frac{1}{4}, \frac{1}{2}, \frac{3}{4}, \frac{3}{2}, \frac{5}{4} \)
Solution: Arithmetic mean
\( \begin{aligned}& =\frac{\text { Sum of observations }}{\text { Number of observations }} \\
& =\frac{\frac{1}{4}+\frac{1}{2}+\frac{3}{4}+\frac{3}{2}+\frac{5}{4}}{5} \\
& =\frac{1+2+3+6+5}{4} \\
& =\frac{17}{4} \times \frac{1}{5}=\frac{17}{20}
\end{aligned} \)
18. In the adjacent double bar graph, number of students of a class are shown according to academic year.
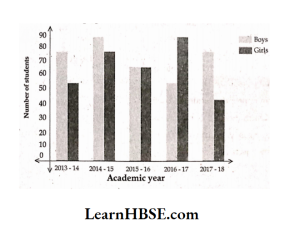
Answer the following questions on the basis of this double bar graph.
1) In which academic year, number of girls were more than number of boys in the school ?
Solution. In 2016-17 academic year,number of girls weremore thannumber of boys in the school.
2) In which academic year, number of both girls and boys in the school were equal?
Solution: In 2015-16 academic year, number of both girlsand boysin the school were equal.
3) What was the total number of students in the school in the academic year 2013-14?
Solution. Total number of students in the academic year 2013-14 was =70 + 50 = 120.
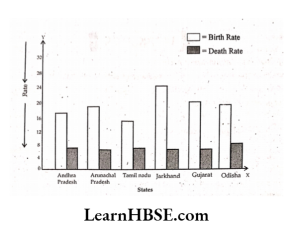
19. Birth and death rates of different states in 2015 are given below. Draw a double bar graph for the given data.
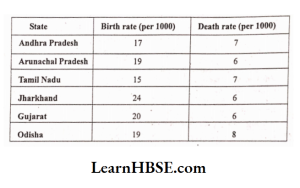
Solution:
Steps in drawing a double bar graph:
1. Draw X-axis (horizontal line) and Y-axis (vertical line) on the graph paper and mark their intersecting point as ‘O’.
2. Take ‘States’ on X-axis
3. Take ‘Birth rate’ and ‘Death rate’ on Y-axis.
4. Take an appropriate scale on Y-axis so that birth rate and death rate can be shown easily. Let us take 1 cm = 2 units on Y-axis.
5. Find the lengths of each bar by dividing the value by 2
Example: Length of bar represents 17 birth
rate = \( \frac{17}{2} \) = 8.5 cm
Length of bar represents 7 death rate = \( \frac{7}{2} \) = 8.5 cm
=3.5 cm.
Important Concepts Data Handling Class 7 HBSE
20. Draw a bar graph for the following data.
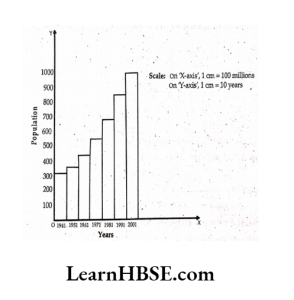
Population of India in successive census years.
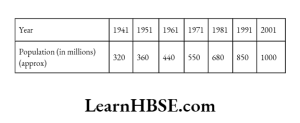
Source: Data from census of India 1991 and 2001
Solution:
Draw X- axis (horizontalline) and Y- axis (verticalline) on the graph paper and mark their intersection as O.
Take years on X – axis
Take population on Y – axis with1 cm as 100 millions so that maximum population fits on the graph sheet.
Graph is drawn against the given values.
Haryana Board Solutions For Class 7 Maths Chapter 3 Data Handling Multiple Choice Question And Answers
1. Which of the following is not a measure of central tendency?
- Mean
- Median.
- Mode
- Range
Answer: 4
2. Range of 3, 50, 6, 19, 5, 43, 2 is
- 52
- 48
- 53
- 46
Answer: 2
3. Mean of first 5 prime numbers is
- 6.5
- 5.2
- 5.6
- 6.2
Answer: 3
4. Mode of the data 14, 6, 12, 6, 13, 6, 14, 6
- 6
- 12
- 13
- 14
Answer: 1
5. Median of x, \(\frac{x}{2}, \frac{x}{3}, \frac{x}{4}, \frac{x}{5} \) is 5. Then x =
- 3
- 9
- 12
- 15
Answer: 4
6. Mean of three observations a, b, c is…………
- \( \frac{a+b+c}{3} \)
- \( \frac{\mathrm{a} \times \mathrm{b} \times \mathrm{c}}{3} \)
- \(\frac{a-b-c}{3} \)
- \(\frac{a \times b+c}{3} \)
Answer: 1
7. The bar graph shows mode of transport to a school. Here, the total no. of students is……………
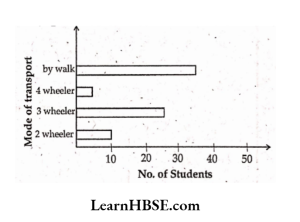
- 50
- 80
- 75
- 100
Answer: 3
Step-by-Step Solutions for Data Handling Class 7 Haryana Board
8. Given below are heights of10 boys of class 7in cm138,128,140,142,129,142,154,144,146, 152. Then the median height is ………….cm
- 142
- 140
- 144
- 146
Answer: 1
9. The bar graph consists of………..
- triangles
- squares
- circles
- rectangles
Answer: 4
10. The bar graph shows, the number of hours studied by Arjun everyday during last 4 years. The mode of the given data belongs to………. year
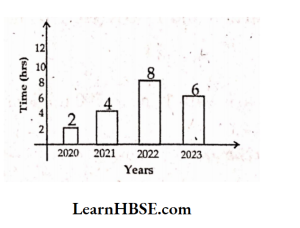
- 2021
- 2022
- 2023
- 2020
Answer: 2
11. The mean of first 5 multiples of 6 is
- 12
- 18
- 24
- 30
Answer: 2
12. Match the following for the given data: -2, 0, 1, 2, 9, 2, 5, 2, -6, -1
a) Mean ( ) 1)2
b) Median ( ) 2)15
c) Mode ( ) 3)1.2
d) Range ( ) 4)1.5
- a-1,b-2, c-3, d-4
- a – 2,b – 3, c – 4, d -1
- a-4,b-1, c-2, d-3
- a-3,b-4,c-1, d-2
Answer: 4
13. Which of the following has the same mean, median and mode ?
- 2, 3, 7, 3, 8, 2, 3
- 4, 3, 4, 3, 4, 6, 4
- 4, 2, 2,1,3, 2, 3
- 6, 2, 5, 4, 3, 4,1
Answer: 2
14. If the arithmetic mean of 5, 6, 2, x, 12 is 8, then x =………..
- 10
- 12
- 8
- 15
Answer: 4
15. The range of the data 6, 3, 0, -5,12, -4 if 2 was subtracted from each of the observations becomes….
- increases
- decreases
- does not change
- zero
Answer: 3
16. Given graph shows the marks of a student in Sumniative Assessment. The average marks of the student is…………
- 76.6
- 75.6
- 77.6
- 76
Answer: 1
17. The median of the data 5, 9, 0, -6, x, 6,1 if their mean is 2 is…………
- 0
- 1
- 2
- 3
Answer: 2
18. The mean offirst two numbers is 2.5, the mean of other three numbers is 9, then mean of all numbers is
- 6.4
- 6.5
- 5.9
- 5.2
Answer: 1
19. For the given data: 3, 5, 6, 3, 4, 3, 2, 6, the mean of its median and mode is
- 3.2
- 3.5
- 3.25
- 4
Answer: 3
20. In bar graphs………of bars remains some
- length
- width
- value
- none
Answer: 2
21. Study the bar graph. The average circulation of newspapers B and C in the month of June is………..
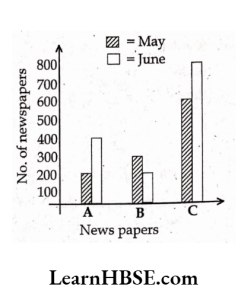
- 450
- 500
- 550
- 475
Answer: 2
22. A vegetable seller collects the following data of vegetables sold in his shopin a day. The mode (most sold vegetable) of the data is ……..
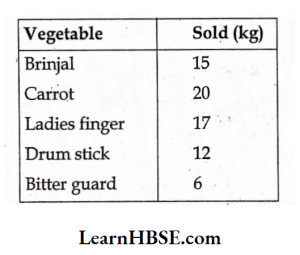
- Drumstick
- Brinjal
- Ladies Finger
- Carrot
Answer: 4
23. The weights of 6 people is given as 38, 42,18, 35, 35, 39, then the mean weight of them is
- 35.4
- 39
- 35
- 34.5
Answer: 4
24. Range of first 10 whole numbers
- 0
- 11
- 9
- 10
Answer: 3
25. The median of observations 8, 10, 12, x + 1, x+3, 25, 29, 35 is 18, then x =
- 15
- 16
- 17
- 18
Answer: 2
26. What is the arithmetic mean of first 10 natural numbers?
- 3.5
- 7.5
- 55
- 5.5
Answer: 4
27. The mean of 2, x, 5, y and 14 is 6 then which of the following is true?
- x + y = 13
- x + y = 9
- x- y = 12
- 2x + y = 13
Answer: 2
28. Find the arithmetic mean of first 6 prime numbers.
- 5.83
- 8.63
- 6.83
- 9.63
Answer: 3
29. Find the mean of first five whole numbers.
- 1
- 2
- 3
- 4
Answer: 2
30. Find the mean of first 6 natural numbers.
- 5.5
- 6.5
- 3.5
- 4.5
Answer: 3
31. The median of first 16 whole numbers is
- 6.5
- 7.5
- 9.5
- 8.5
Answer: 2
32. What is the shape of each partin pie chart ?
- Sector
- Chart
- Cone
- Cylinder
Answer: 1
33. The median of the data 24, 29, 34, 38, x is 29, then value of x is
- more than 38
- less than 29
- between 29,34
- none of these
Answer: 2
34. Total data is represented as relative size of components in a
- Pie diagram
- Pictograph,
- Bar graph
- Sector
Answer: 1
35. The most frequently occurring value for a set of observations is called
- Arithmetic mean
- Median
- Mode
- Range
Answer: 3
36. The median of first 5 even natural numbers
- 6
- 8
- 10
- 30
Answer: 1
Practice MCQ’s Handling Class 7 Haryana Board
37. The sum of four observations is 44. What is the mean ?
- 10
- 9
- 8
- 11
Answer: 4
38. The mean of 11 observations is 12. What is the sum of observations?
- 122
- 132
- 142
- 152
Answer: 2
In a survey finding, number of people watching TV serials aregiven below. Answer the following questions (39 – 40)
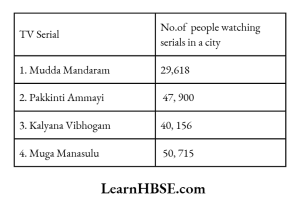
39. Which is the “most popular show” from the above table?
- Mudda Mandaram
- Pakkinti Ammay
- Kalyana Vibhogam
- Muga Manasulu
Answer: 4
40. Which concept is used to know “most popular show” ?
- Mean
- Median
- Mode
- None
Answer: 3
State which representative has to be taken to decide in the folloivittg situations (41-43).
41. Aninvigilator wants to bring sufficient number of additional papers to the examination hall.
- mean
- mode
- median
- none
Answer: 1
42. Preparation of number of laddus for a marriage
- mean
- mode
- median
- none
Answer: 1
43. For finding the favourite cricketer in a class
- mean
- mode
- median
- None
Answer: 2
44. Find the median of first five odd natural numbers.
- 5
- 4
- 2
- 8
Answer: 1
45. What is the mode ofunit digits that are presentin the numbers between 50 to 60 ?
- 1
- 5
- 2
- Nil
Answer: 4
46. When there is no mode for a particular data we can say the mode is
- 1
- 0
- 2
- None
Answer: 4
47. What is the mean of factors of 12 ?
- 5.66
- 3.76
- 4.66
- 8.66
Answer: 3
48. What is median of first 5 multiples of 11?
- 32
- 33
- 34
- 35
Answer: 2
49. The mean of x+2, x+7, x+6 is 15. Then find the observations.
- 11,12,16
- 12, 17, 16
- 13,16,17
- 15, 16, 17
Answer: 2
Weight of food that Raj ate each day is given in the table
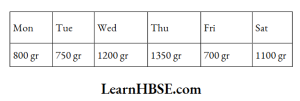
50. How much weight of food per day does he eat on an average?
- 783.13
- 873.3
- 983.3
- 784.3
Answer: 3
The following table shows the scores of player in each game. Observe it and answer the following questions. (51 – 52)
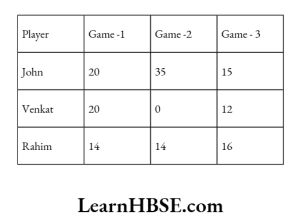
51. Who is the best player?
- John
- Venkat
- Rahim
- All
Answer: 1
52. Which mathematical concept is used to know the best player?
- Mean
- Median
- Mode
- All
Answer: 1
53. Identify the one which is not affected by maximum and minimum value of the data.
- Mean
- Mode
- Median
- None
Answer: 3
54. Find the difference between mean and median of the following data 3, 16, 24, 13
- 1.5
- 2.5
- 0.5
- 3.0
Answer: 3
Observe the table and answer 55, 56 questions based on this table.
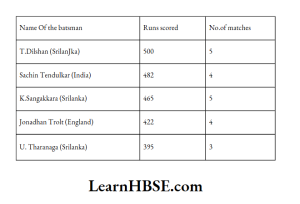
55. Who is the best batsman from the table?
- T.Dilshan
- Sachin Tendulkar
- K.Sangakkara
- Tharanga
Answer: 4
56. Who is average batsman?
- Sachin Tendulkar
- Jonadhan ,
- K. Sangakkara
- T. Dilshan
Answer: 2
57. Nani Practices Yoga regularly for a week as follows.
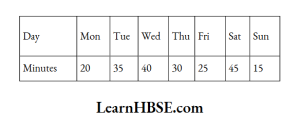
The average time spent per day by Nani is ….
- 25 min
- 32 min
- 24 min
- 30 min
Answer: 4
58. From this what can you conclude? ( )
- Mean is nothing but average
- Mean always lies between the highest and lowest observations of the data
- Mean is representative of data
- None
Answer: 2
59. A data of 10 observations has a minimum value 15 and maximum value 25. What is the mean of the data?
- 12
- 15
- 21
- 27
Answer: 3
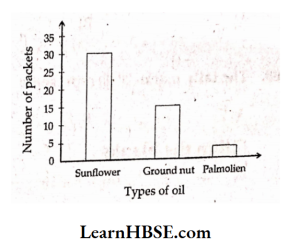
60. From the graph what is the mode here?
- Sunflower
- Groundnut
- Palmolien
- All
Answer: 1
61. The presentation of data can be of ………
- Bar graph
- Double bar graph
- Pie chart
- Above all
Answer: 4
Observe the graph and answer the following questions. (62- 63)
62. Find the ratio between sale of Jowar and sale of Sugar ?
- 10: 5
- 2:1
- 2:3
- A and B
Answer: 4
63. How much is the sale of Rice more over Wheat?
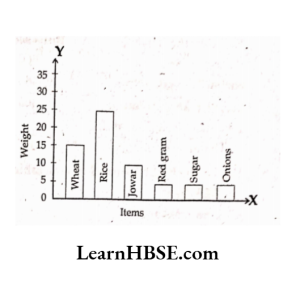
- 5
- 10
- 15
- 20
Answer: 2
Observe the adjacentfigure and answer thefollowing questions. (64- 65)
64. What are the total marks of Vani in both Mathematics and Science?
- 85
- 70
- 110
- 100
Answer: 1
65. In which subject Raju is well
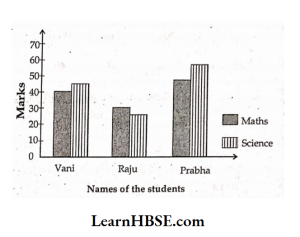
- Maths
- Science
- Social
- Telugu
Answer: 1
66. Mode of the given set of numbers 1,1, 1, 2, 2, 2, 2, 3, 3, 4, 4, is
- 1
- 2
- 3
- 4
Answer: 2
67. The most common representative value of a group of a data is
- Arithmetic mean
- Range
- Mode
- Median
Answer: 1
68. The average of \( \) and \( \frac{1}{2} \)
- \( \frac{1}{8} \)
- \( \frac{1}{2} \)
- \( \frac{3}{8} \)
- \( \frac{3}{4} \)
Answer: 3
69. The tally marks ||||.||| represents
- 7
- 8
- 9
- 6
Answer: 2
Fill in the blanks:
70. We use…… for recording and organisation of data
Answer: Tally marks
71. In a bar graph …… of all the bars is same
Answer: Width
72. ……. help to compare two collections of data at a glance
Answer: Double graph
73…….. represents data in the form of pictures.
Answer: Pictograph
74. Representing the data with the help of bars is known as…………..
Answer: bar graph
Match the following:
75.
1. Mean of 5 and 11 is ( ) A) 20
2. Range of 23, 26, 28, 32, 54, 41 is ( ) B) 12
3. Median of 19, 25, 23, 20, 9, is ( ) C) 8
4. Mode of 12, 14, 12, 16, 12 is ( ) D) 10
5. The tally marks |||| |||| represents ( ) E) 31
Answer: 1. C 2. E 3. A 4. B 5. D