
Haryana Board Class 6 Maths Solutions For Chapter 9 Data Handling
- ‘Data’ is a collection of numbers gathered to give some information.
- ‘Information’ is either in the form of numbers or words.
- To get a particular information from the given data quickly, the data can be arranged in a tabular form using tally marks.
- Data that has been organised and presented in ‘frequency distribution tables’ can also be represented using ‘pictographs’ and ‘bar graphs’.
- Representation of the data in the form of pictures, objects or parts of objects is called ‘pictograph’ or ‘pictogram’.
- A pictograph uses pictures or symbols to represent the frequency of the data.
- In pictograph the size of all pictures should be the same and should represent the same number of items of the data.
- We use tally marks for recording and organisation of data.
- Representation of data can be done in the following ways (1) Pictographs (2) Bar graphs.
- The pictographs represents the representation of the data through pictures.
- “P.C. Mahalanobis” is known as father of Indian Statistics.
Haryana Board Class 6 Maths Solutions For Chapter 9 Data Handling Exercise 9.1
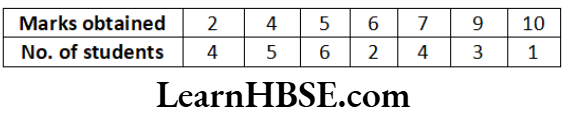
Question 1. In a Mathematics test, the following marks were obtained by 40 students. Arrange these marks in a table using tally marks.
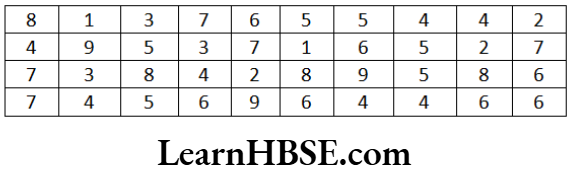
a) Find how many students obtained marks equal to or more-than 7.
b) How many students obtained marks below 4?
Solution.
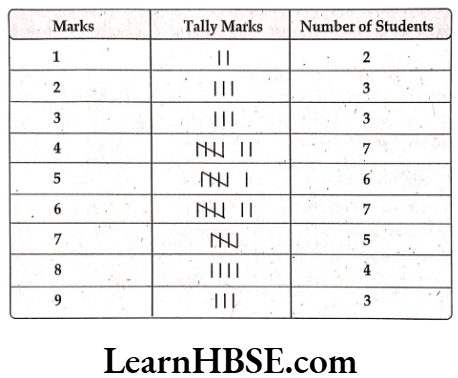
a) 5 + 4 + 3 = 12 students obtained marks equal to or more than
7 (7 marks – 5 students, 8 marks – 4 students; 9 marks – 3 students)
b) 3 + 3 + 2 = 8 students obtained marks below 4.
Haryana Board Class 6 Maths Data Handling solutions
Question 2. Following is the choice of sweets of 30 students of Class VI: Ladoo, Barfi, Ladoo, Jalebi, Ladoo, Rasgulla, Jalebi, Ladoo, Barfi, Rasgulla, Ladoo, Jalebi, Jalebi, Rasgulla, Ladoo, Rasgulla, Jalebi, Ladoo, Rasgulla, Ladoo, Ladoo, Barfi, Rasgulla, Rasgulla, Jalebi, Rasgulla, Ladoo, Rasgulla, Jalebi, Ladoo.
a) Arrange the names of sweets in a table using tally marks.
b) Which sweet is preferred by most of the students?
Solution. a)
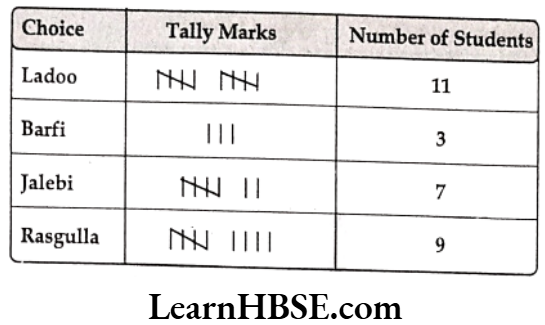
b) Ladoo is preferred by most of the students.
Question 3. Catherine threw a dice 40 times and noted the number appearing each time as shown below:
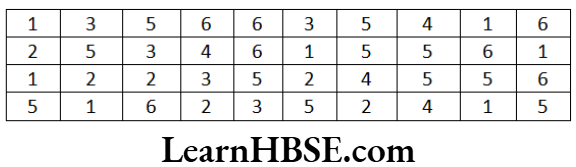
Make a table and enter the data using tally marks. Find the numbers that appeared:
a) The minimum number of times.
b) The maximum number of times.
c) Find those numbers that appear an equal number of times.
Solution.
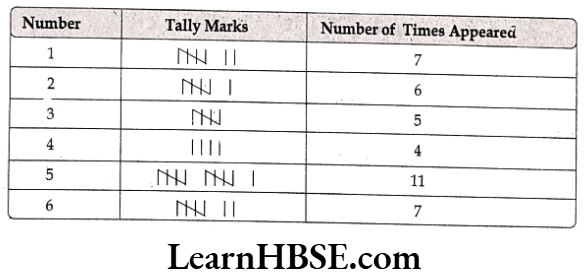
a) Number 4 appeared minimum number of times.
b) Number 5 appeared maximum number of times.
c) Number 1.and 6 appeared equal number of times.
Question 4. Following pictograph shows the number of tractors in five villages.
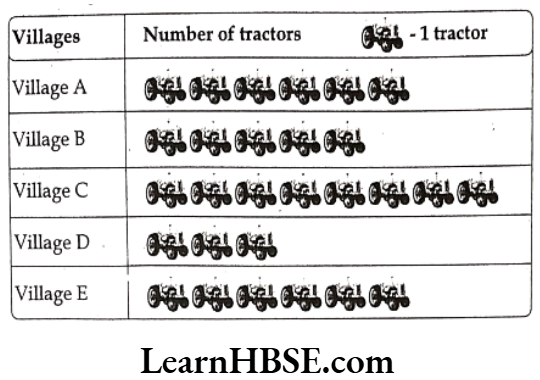
Observe the pictograph and answer the following questions.
1) Which village has the minimum number of tractors?
Solution. Village D has the minimum number of tractors – 3.
2) Which village has the maximum number of tractors?
Solution. Village C has the maximum number of tractors – 8.
3) How many more tractors village C has as compared to village B ?
Solution. Village C has 8 – 5 = 3 more tractors as compared to village B.
4) What is the total number of tractors in all the five villages?
Solution. Total number of tractors in all the five villages = 6 + 5 + 8 + 3 + 6 = 28.
Question 5. The number of girl students in each class of a co-educational middle school is depicted by the pictograph.
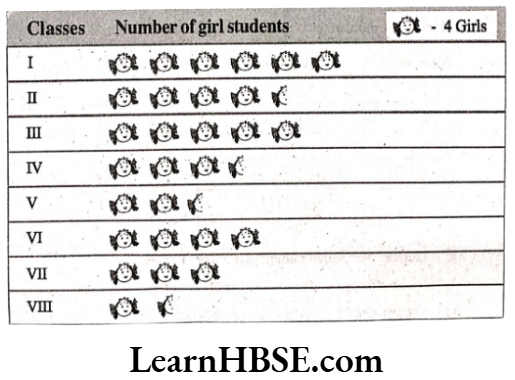
Observe this pictograph and answer the following questions:
a) Which class has the minimum number of girl students?
Solution. Class VIII has the minimum no. of girl students (6).
b) Is the number of girls in class VI less than the number of girls in Class V ?
Solution. No, the number of girls (16) in class VI is not less than the number of girls (10) in class V.
c) How many girls are there in class VII?
Solution. Number of girls in class VII = 3 x 4 = 12.
How to draw a pictograph Class 6 HBSE
Question 6. The sale of electric bulbs on different days of a week is shown below:
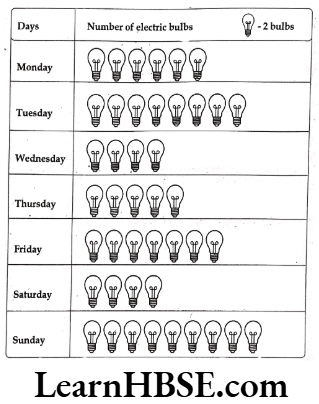
Observe the pictograph and answer the following questions:
a) How many bulbs were sold on Friday.
Solution. 14 bulbs were sold on Friday.
b) On which day were maximum number of bulbs sold?
Solution. Maximum bulbs were sold on Sunday.
c) On which of the days same number of bulbs were sold?
Solution. Equal no. of bulbs were sold on Wednesday and Saturday.
d) On which of the days minimum number of bulbs were sold?
Solution. Minimum bulbs were sold on Wednesday and Saturday.
e) If one big carton can hold 9 bulbs. How many cartons were needed in the givenweek?
Solution. No. of bulbs can hold in one big carton = 9
No.of cartons were need = 86 ÷ 9
= 10 (Approx)
Question 7. In a village six fruit merchants sold the following number of fruit baskets in a particular season:
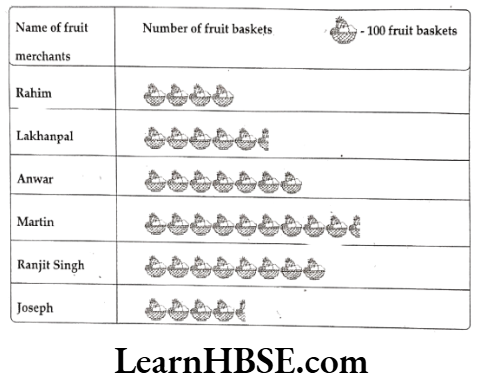
Observe this pictograph and answer the following questions:
a) Which merchant sold the maximum number of baskets?
Solution. Martin sold the maximum number of baskets – 950.
b) How many fruit baskets were sold by Anwar?
Solution. 7 x 100 = 700 fruit baskets were sold by Anwar.
c) The merchants who have sold 600 or more number of baskets are planning to buy a godown for the next season. Can you name them?
Solution. Anwar, Martin and Ranjit Singh are planning to buy a godown for the next season.
Haryana Board Class 6 Maths Solutions For Chapter 9 Data Handling Very Short Answer Questions
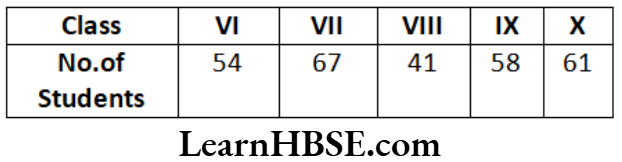
Question 1. Give two examples of data in numerical figures.
Solution. Example: 1
The number of students in each class in a school:
Example: 2
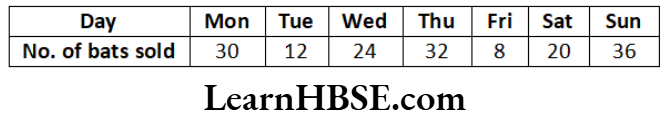
The details of number of cricket bats sold in a week:
Question 2. Give two examples of data in words.
Solution. Example: 1
Days of a week
MON, TUE, WED, THU, FRI, SAT, SUN.
Example: 2
Important cities in Andhra Pradesh.
Vijayawada, Guntur, Tirupathi, Visakhapatnam, Machilipatnam, Nellore, Kakinada.
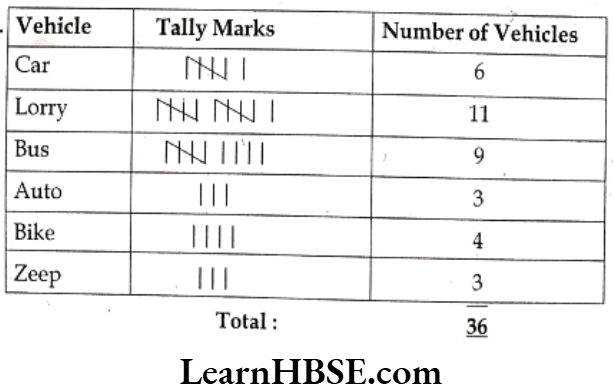
Question 3. Vehicles that crossed a checkpost between 10 AM and 11 AM are as follows:
car, lorry, bus, lorry, auto, lorry, lorry, bus, auto, bike, bus, lorry, lorry, zeep, lorry, bus, zeep, car, bike, bus, car, lorry, bus, lorry, bus, bike, car, zeep, bus, lorry, lorry, bus, car, car, bike, auto.
Represent the data in a frequency distribution table using tally marks.
Solution.
Frequency table and data interpretation Class 6
Question 4. The following pictograph shows the number of students use cycles, in five classes of a school.
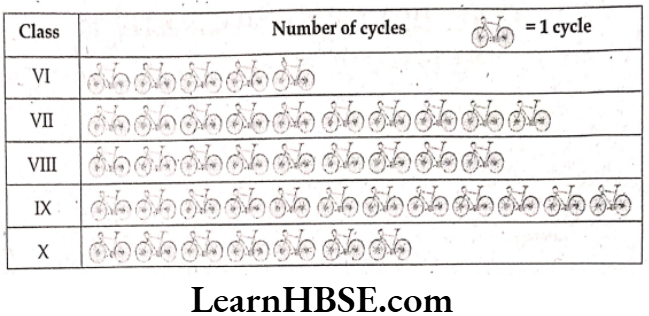
Answer the following questions based on the pictograph given above –
1) Which class students have the maximum number of cycles?
2) Which class students have the minimum number of cycles?
3) Which class students have 9 cycles?
4) What is the total number of cycles in all the five classes?
Solution. 1) IX class students have the maximum number of cycles.
2) VI class students have the minimum number of cycles.
3) VIII class students have 9 cycles.
4) Total number of cycles in all the five classes:
VI 5
VII 10
VIII 9
IX 12
X 7
Total 43
Question 5. A book-shelf has books of different subjects. The number of books of each subject is represented as a pictograph given below. Observe them.
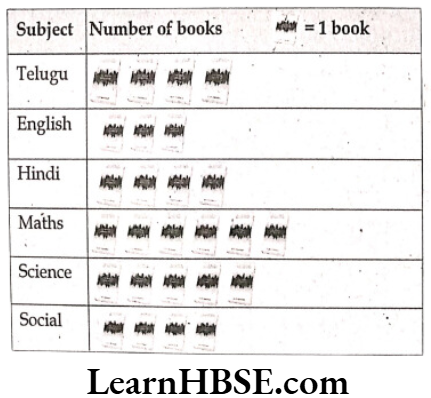
Answer the following questions:
1) Which books are more in number?
Solution. Maths
2) Which books are least in number?
Solution. English
3) How many total books are there ?
Solution.
Telugu 4
English 3
Hindi 4
Maths 6
Science 5
Social 4
Total 26
Question 6. 26 students in a class got the following marks in an assignment – 5, 6, 7, 5, 4, 2, 2, 9, 10, 2, 4, 7, 4, 6, 9, 5, 5, 4, 3, 7, 9, 5, 2, 4, 5, 7. The assignment was for 10 marks.
1) Organise the data and represent in the form of a frequency distribution table using tally marks.
2) Find out the marks obtained by maximum number of students.
3) Find out how many students received least marks.
4) How many students got 8 marks?
Solution. 1)
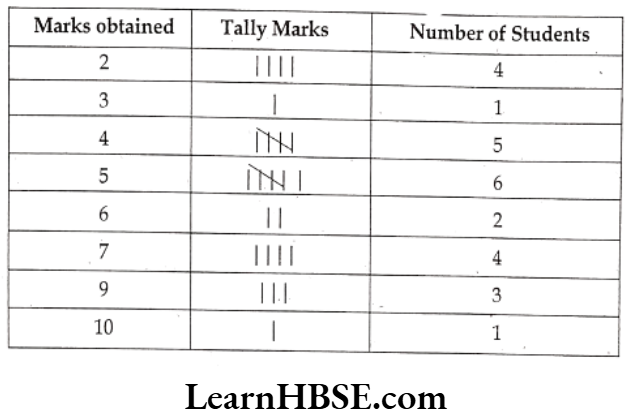
2) Maximum number of students (6) got 5 marks.,
3) Least mark (2) was obtained by 4 students.
4) No student in the class got 8 marks.
How to create a bar graph Class 6 Haryana Board
Question 7. In a class of 25, students like various games. The details are shown in the following pictograph. (No student plays more than one game).
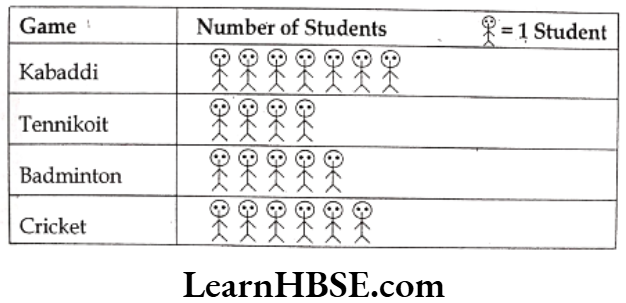
1) How many students play badminton?
2) Which game is played by most number of students ?
3) What is the game in which least number of students are interested?
4) How many students do not play any game?
Solution. 1) 5 students play badminton.
2) Kabaddi is played by most number of students i.e., 7.
3) Tennikoit is played by least number of students i.e., 4.
4) Total number of players = 7 + 4 + 5 + 6 = 22
Number of students in the classroom = 25.
Thus, the number of students who do not play any game = 25 – 22 = 3
Question 8. Give two examples of data in numerical figures.
Solution. 1) The population of Andhra Pradesh in (2011) – 4,96,34,314
2) The cost of I phone 11 pro-1,21,889.
Question 9. Give two examples of data in words.
Solution. 1) The cost of Maruti Brezza [Z x 1] price on road in India – Nine lakh ten thousand rupees only.
2) The population of India according to census 2011 – One hundred and twenty one crore eight lakhs fifty four thousand nine hundred and seventy seven.
Haryana Board Class 6 Maths Solutions For Chapter 9 Data Handling Short Answer Questions
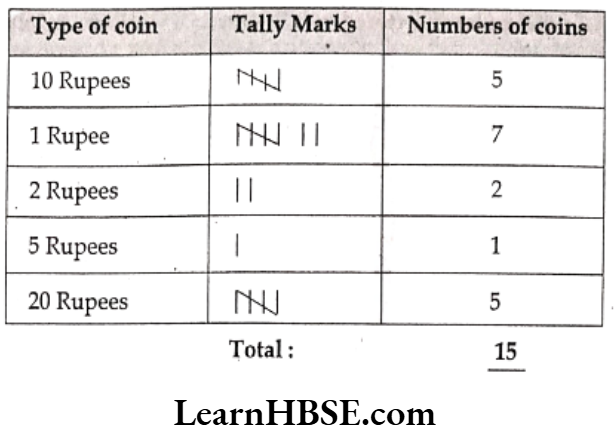
Question 10. A child’s Kiddy bank is opened and the coins collected are in the following denomination.
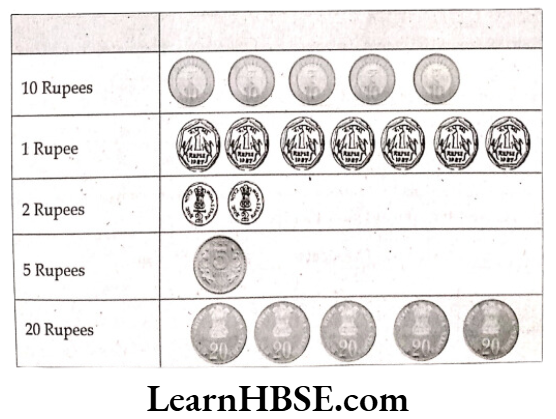
Represent the data in a frequency distribution table using tally marks.
Solution.
Question 11. The favourite colours of 25 students in a class are given below:
Blue, Red, Green, White, Blue, Green, White, Red, Orange, Green, Blue, White, Blue, Orange, Blue, Blue, White, Red, White, White, Red, Green, Blue, Blue, White.
Write a frequency distribution table using tally marks for the data. Which is the least favourite colour for the students ?
Solution.
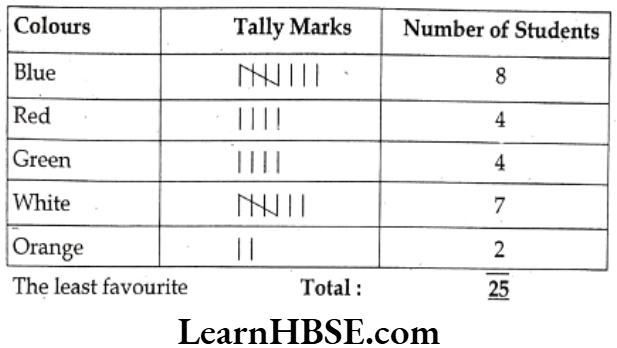
colour for the students = 2 (Orange)
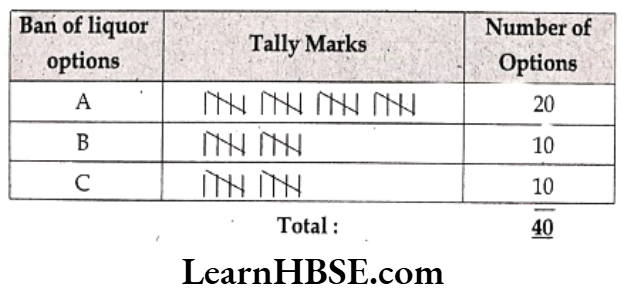
Question 12. A TV channel invited a SMS poll on ‘Ban of Liquor’ giving options:-
A – Complete ban
B – Partial ban
C – Continue sales
They received the following SMS, in the first hour-
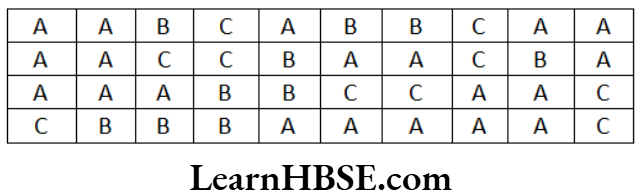
Represent the data in a frequency distribution table using tally marks.
Solution.
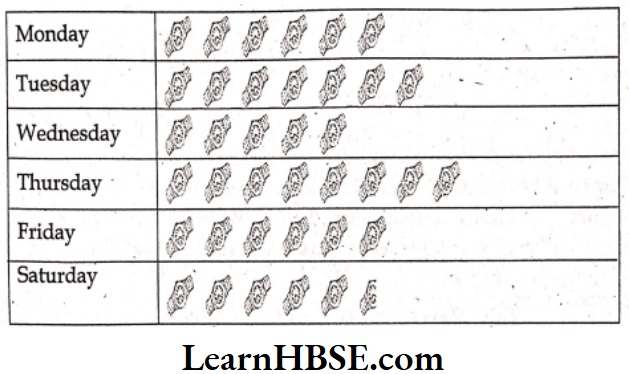
Question 13. The number of wrist watches manufactured by a factory in a week are as follows:
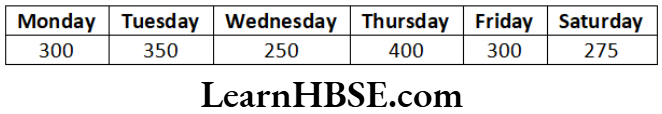
Represent the data using a pictograph. Choose a suitable scale.
Solution. = 50 watches.
Question 14. Votes polled for various candidates in a sarpanch election are shown below, against their symbols in the following table.
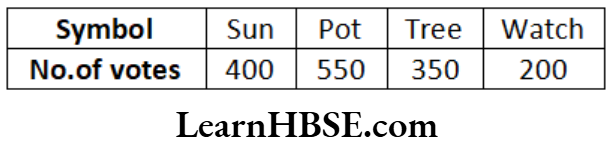
Represent the data using a pictograph. Choose a suitable scale.
Answer the following questions:
1) Which symbol got least votes?
2) Which symbol candidate won in the election?
Solution. Each represents 50 votes
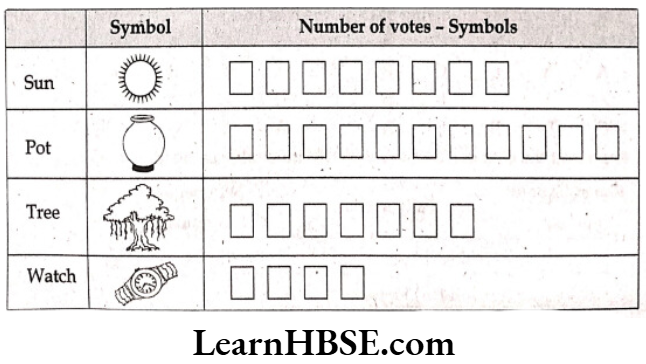
1) Watch symbol got least votes.
2) Pot symbol candidate won in the election.
Question 15. The sale of television sets of different companies on a day is shown in the pictograph given below. Scale: = 5 televisions
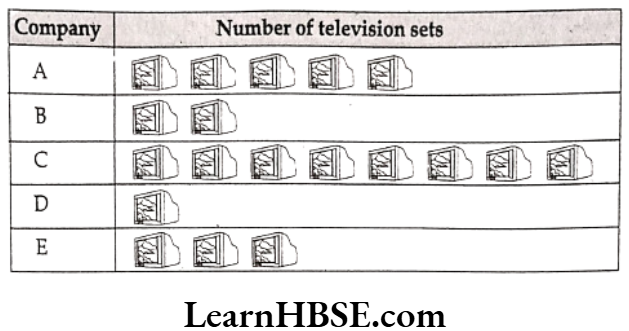
Answer the following questions:
1) How many TVs of company A were sold?
2) Which company’s TVs are people more crazy about?
3) Which company sold 15 TV sets?
4) Which company had the least sale?
Solution. 1) Number of TV’s sold by company A = 5 x 5 = 25
2) People more crazy about the TV company ‘C’.
3) Company ‘E’ sold 15 TV sets.
4) Company ‘D’ sold least sale.
Haryana Board Class 6 Maths Solutions For Chapter 9 Data Handling Long Answer Questions
Question 16. Given below are the ages of 20 Students of Class VI in a School.
13, 10, 11, 12, 10, 11, 11, 13, 12, 11, 10, 11, 12, 11, 13, 11, 10, 13, 10, 12
1) Organise the data and represent in the form of a frequency distribution table using tally marks.
Solution.
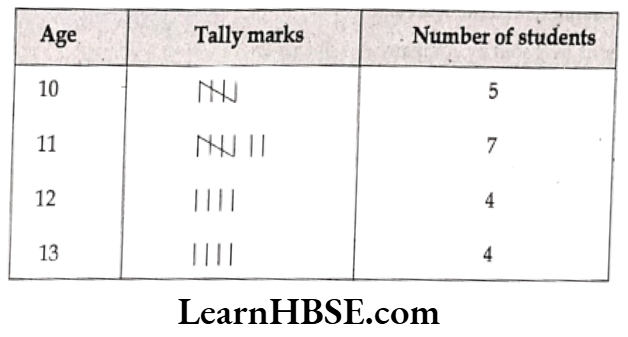
2) Find out the age having more number of students
Solution. More number of students having the age is 11 years.
3) How many students are there in 10 Years age?
Solution. 5 students
4) Find out number of students who are having more age?
Solution. Number of students who are having more age 13 years is 4.
Question 17. A die was thrown 30 times and following scores were obtained
5 3 4 6 2 3
6 2 2 3 15
2 5 4 6 2 1
4 5 1 6 2 1
3 1 3 3 4 6
Word problems on pictographs and bar graphs Class 6
1) Prepare a frequency table of the scores.
Solution.
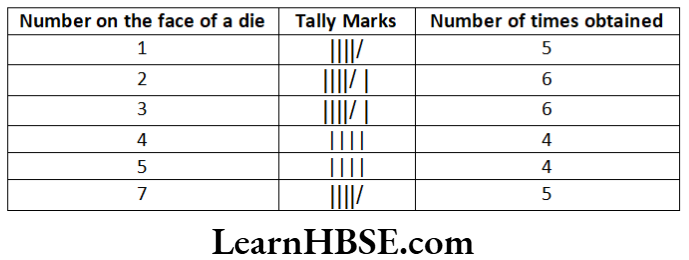
2) Which number obtained more times?
Solution. The numbers 2 and 3 obtained more times ie., 6.
3) How many times was a score greater than 4 obtained?
Solution. The number of times a score greater than 4 obtained was 4 + 5 = 9
4) Find the total number of times an odd number obtained.
Solution. Total number of times an odd number obtained is = 5 + 6 + 4
= 15 [1, 3 and 5 are faces of a dice]
Haryana Board Class 6 Maths Solutions For Chapter 9 Data Handling Objective Type Questions
Choose the correct answer:
Question 1. The information collected in terms of numbers
theorem
data
mean
range
Answer. 2. data
Question 2. Representing the data in terms of pictures is
Bar graphs
Bar charts
Pictographs
Pie charts
Answer. 3. Pictographs
Question 3. While drawing pictures in a pictograph all ………… must be equal.
lengths
sizes
breadths
bases
Answer. 2. sizes
Question 4. ![]() || indicates ….
|| indicates ….
7
6
3
5
Answer. 1. 7
Question 5. If a * represents 3 cars, how many * are required to indicate 18 cars?
3
6
8
12
Answer. 2. 6
Question 6. If 6 cm represent 9 lakh people then the scale is ………..
1 cm = 1,50,000
2 cm = 1,00,000
1 cm = 2,00,000
1 cm = 1,20,000
Answer. 1. 1 cm = 1,50,000
Question 7. In a data maximum value = 30 and the minimum value is 10. Then the range is
31
12
20
16
Answer. 3. 20
Question 8. 13 can be represented by tally marks as
![]()
![]()
![]()
![]() |||
|||
![]() ||
||
![]()
![]()
![]() |
|
Answer. 2. ![]()
![]() |||
|||
Question 9. According to the scale \(\frac{1}{2}\) cm = 15 students then 45 students = …… cm
8
4
7
\(\frac{3}{2}\)
Answer. 4. \(\frac{3}{2}\)
Question 10. ………. are used in preparing frequency table
Symbols
Tally marks
Data
Scale
Answer. 2. Tally marks
Data Handling examples for Class 6 HBSE Maths
Question 11. Which of the following indicates ‘5’
|||||
![]()
|||
![]()
![]()
Answer. 2. Diagram
Question 12. Average of 1, 2, 3 is
- 2
- 3
- 8
- 3.5
Answer. 1. 2
Question 13. Statement – a: A table showing the frequency or count of various items is called a frequency distribution.
Statement – b: To get a particular information from the given data quickly, the data can be arranged in a tabular form using tally marks.
- both a & b are true
- a is true b is false
- a is false, b is true
- both a & b are false
Answer. 1. both a & b are true
Question 14. Father of Indian Statistics
- Ramanujan
- Aryabhata
- P.C.Mahalanobis
- Bhaskaracharya
Answer. 3. P.C.Mahalanobis
Question 15. If represents = 10 books then represent = …….books.
- 10
- 20
- 30
- 40
Answer. 4. 40
Answer the questions [16-19] from the information given below.
Question 16. How many marks obtained by maximum number of students?
- 5
- 6
- 2
- 10
Answer. 1. 5
Question 17. How many students received least marks?
- 1
- 2
- 4
- 10
Answer. 3. 4
Question 18. How many students got 8 marks?
- 1
- 4
- 21
- 0
Answer. 4. 0
Question 19. How many students got more than 8 marks?
- 3
- 4
- 8
- 21
Answer. 2. 4
Question 20. If represents 5 eggs, then how many eggs do represent?
- 20
- 25
- 100
- 30
Answer. 2. 25
Question 21. If represents 5 balloons, then the number of symbols to be drawn to represent 70 balloons is
- 12
- 10
- 15
- 14
Answer. 4. 14
Question 22. The number of members in 20 families in a village is given as 6, 8, 6, 3, 2, 5, 7, 8, 6, 5, 5, 7, 7, 8, 6, 6, 7, 7, 6, 5.
How many families are of the largest size?
- 4
- 3
- 5
- 6
Answer. 2. 3
Question 23. The number of times an observation occurs is called
- frequency
- data
- tallymarks
- none
Answer. 1. frequency
Haryana Board Class 6 Maths Solutions For Chapter 9 Data Handling Fill in the blanks:
Question 24. Diagram represents ……
Answer. 5
Question 25. 1 + 3 + 4 + 5 + 6 + 7 + 8 + 10 = ……….
Answer. 44
Question 26. ……………… collection of numbers gathered to give some information.
Answer. Data
Question 27. Average of -2, -1, 0, 1, 2, … ………….
Answer. 0
Question 28. According to a scale \(\frac{1}{2}\) cm = 20 students then 60 students
Answer. 3/2
Question 29. Range of first 10 whole numbers is ………
Answer. 9
Question 30. Range of first 100 even natural numbers is = …….
Answer. 98
Question 31. Show 12 as tally mark…………….
Answer. ![]()
![]() ||
||
Question 32. Collection of certain information is called …….
Answer. data
Question 33. Representing the data in the form of pictures is called ………
Answer. pictograph
Question 34. If Diagram represents 150 then Diagram represent …….
Answer. 750
Question 35. If 100 books = Diagram then 150 books are represented by ……….
Answer. ▢▢ ▢
Question 36. The tally marks ![]()
![]() ||| represent ………..
||| represent ………..
Answer. 13
Question 37. Which are used in preparing frequency table are ……..
Answer. Tally marks
Question 38. The tally marks to represent 16……………..
Answer. ![]()
![]()
![]() |
|