
Thermodynamics – First And Second Law Of Thermodynamics pV Diagram Or Indicator Diagram
pV Diagram Or Indicator Diagram: An indicator diagram or pV-diagram is drawn by plotting the volume V along the horizontal axis and the pressure p along the vertical axis. The utilities of such a diagram are:
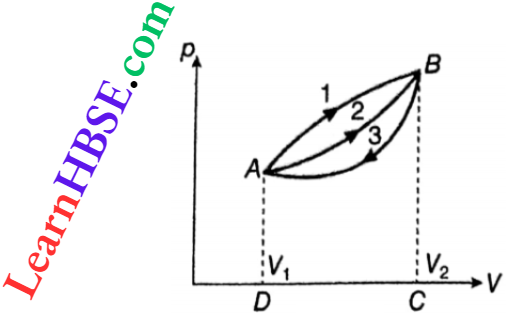
1. A point (say, A) represents fixed equilibrium values of p and V. Then, following the equation of state, the temperature will also have an equilibrium value. So, this expresses the equilibrium state of a system. A point = an equilibrium state.
PV Indicator Diagram For Carnot Cycle
2. The two points A and B represent two equilibrium states. So, any line joining them, with an arrow, like 1 or 2, represents a process A → B
A line = a process.
The same two points may be joined by different lines, like 1 or 2. This means that, different processes can be performed between the same two states. The line 3 in denotes a process B → A.
3. Work done in a finite process from volume V1 to volume V2 is,
W = \(\int_{V_1}^{V_2} p d V\)
In integral calculus, we know that an integral has a graphical representation. Using that concept, it can be inferred that the work done W in a process is represented by the area under the line denoting the process and above the V-axis of the pV-diagram.
For example, work done in the process A → B(1) = area AlBCD A. In general, on a pV diagram, an area = an amount of work done.

PV Indicator Diagram For Different Thermodynamic Processes
The process B → A represents a contraction so W is negative. Therefore, an area under a line going from a higher to a lower volume represents a negative amount of work.
Clearly, an isochoric process (volume = constant) is represented by a vertical line (say, AB) on a pV-diagram.
It encloses no area under it; so, work done, W = 0.
Again, an isobaric process (pressure = constant) is represented by a horizontal line (say, CD). The area under this is p(V2 – V1) so, the work done in this process, W = p(V2-V1)
If a system, after any number of individual processes, comes back to its initial state, it is said to have gone through a cyclic process or cycle. It is represented by a closed curve, like ABCA, on a pV-diagram.
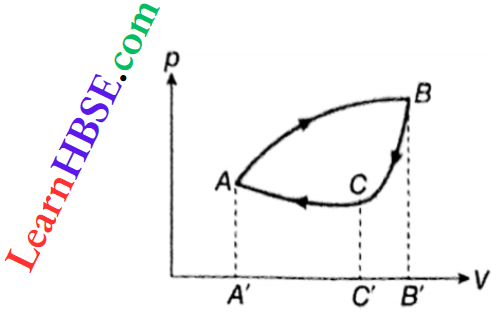
Clearly, the initial state s the final state = state A. The work done in such a cycle is
W= WAB+ WBC+ WCA
W= area ABB’A’A – area BB’C’CB – area CC’A’AC
W= area ABCA
Thus, the work done in a cycle = area enclosed by the cycle on the pF-diagram. This work is positive for a clockwise cycle, like ABCA, but is negative for an anticlockwise cycle, for example, if the process was ACBA.
Positive work indicates that work is done by the system and negative work represents work done on the system.
Thermodynamics – First And Second Law Of Thermodynamics pV Diagram Or Indicator Diagram Numerical Examples
PV Indicator Diagram For Otto And Diesel Cycles
Example 1. The volume of a gas changes from 20 I to 10 I under a pressure of 106 dyn • cm-2. What will be the heat evolved?
Solution:
Given
The volume of a gas changes from 20 I to 10 I under a pressure of 106 dyn • cm-2
Work done on the gas, W = \(p\left(V_2-V_1\right)=10^6(20-10) \times 10^3\)
= \(10^{10} \mathrm{erg}=10^3 \mathrm{~J}\)
∴ Heat evolved, Q = \(\frac{W}{J}=\frac{10^3}{4.2}\) = 238.1 cal.
PV Indicator Diagram Explanation With Example
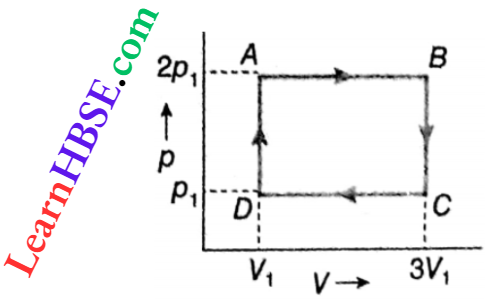
Example 2. Find out the amount of work done in the cyclic process.
Solution:
Work done in the cycle ABCD = area AB · CD = AB · BC
= \(\left(3 V_1-V_1\right)\left(2 p_1-p_1\right)=2 p_1 V_1 .\)